SPORTS DATA ENGINEERING · VALIDATION · IN PROGRESS

NBA Analytics Platform

Raw play-by-play to my own possessions, checked game by game against an independent reference

Every per-100-possession number in basketball depends on judgment calls: when a possession ends, what to do with technical free throws, who gets credit when a substitution happens between free throws. I built a database of every NBA game since 1996-97 in which each of those calls is written down, versioned and tested, and then compared my possession counts with pbpstats, an established public reference, team by team and game by game. This page is about the moment the two stopped agreeing, and why I did not make them agree.

Individual project · Python · DuckDB · SQL · Streamlit · pytest · 1996-97 → 2025-26 · October 2026

INPUT37,986 games17.5M events · 6.3M shots · 60 season files
RULESOne config fileVersioned · two rule profiles
OUTPUT7.3M possessions1.16M stints · every row stamped with its rules version
NEXTCustom rulesOn/off, lineups, matchups and a RAPM prototype are built
01 — THE CHALLENGE

Every public metric hides a judgment call.

An offensive rebound does not start a new possession. An and-1 free throw belongs to the possession of the basket. A technical free throw belongs to no possession at all. A heave with one second left can distort a lineup's efficiency. Public numbers make these choices silently; here each one is a named rule in a configuration file, with a decision date, worked examples from real games and an automated test. Rules start from a pbpstats_compat profile that copies the reference, so that every later change is a deliberate, documented deviation.

STEP 01raw

Ingest

Raw files are never modified; each one is recorded with its URL, download time and SHA-256. Fixes go in a corrections table.

STEP 02✓ / !

Validate

Hard checks stop a season (unknown player, duplicate key, the same player twice in a lineup). Warnings are reported, never silently fixed.

STEP 03rules

Build

Stints (the ten players on court) and possessions are built from the rules file, keeping the original event order.

STEP 04Δ

Compare

Possession counts are compared with pbpstats per team and game. Every gap is investigated and explained.

02 — THE DROP

Sixteen seasons of agreement, then a cliff.

From 2000-01 to 2015-16 my possession count equals pbpstats' in 97–99% of team-games, and is within one possession in 99.9–100%. From 2016-17 the share of identical counts falls to about 78%, in every season. My code had not changed between those seasons, so something in the data had.

TEAM-GAMES WITH IDENTICAL POSSESSION COUNTS · REGULAR SEASON · MEASURED
100%
75%
50%
'01
'02
'03
'04
'05
'06
'07
'08
'09
'10
'11
'12
'13
'14
'15
'16
'17
'18
'19
'20
'21
'22
'23
'24
'25
Source clock in whole seconds Source clock in tenths of a second (from 2016-17) Season labelled by its end year. Within one possession: 99.9–100% before, 94.7–98.3% after.
TRY IT · THE RULE BEHIND THE GAP

A possession starts with 2.4 seconds left in the quarter and scores 0 points. Is it an end-of-period heave?

ABOUT 500–560 PER SEASON

The shared rule: a possession that starts with 2 seconds or less left in the period and scores nothing is flagged as a heave and left out of efficiency, because a desperation shot says little about a lineup.

Reveal how each side counts it ↓

pbpstats appears to read it as 2 seconds, so it is a heave. I compare the exact time, 2.4 > 2, so it is not.

Through 2015-16 every possession in the source starts on a whole second, so the two readings never differ. From 2016-17 the clock carries tenths of a second (21,309 fractional possession starts in 2016-17 alone), and about 500–560 scoreless possessions per regular season start with between 2 and 3 seconds left. That single comparison explains most of the drop.

My first explanation was wrong. I initially concluded that pbpstats simply does not count about 515 empty final possessions per season. Comparing whole games side by side showed that pbpstats does have those possessions; my matching method had mislabelled them. I corrected the decision log rather than delete the wrong entry, because the path to an answer is part of the evidence.

03 — THE DECISION

Matching the number was one line away.

Comparing whole seconds instead of the exact time restores the agreement almost completely, and changes nothing before 2016-17. I tested it and kept the exact time. A possession that starts with 2.4 seconds left is a real possession with time to run a play; counting it as a heave would make my data match the reference by making it less accurate. The difference is now a named setting (end_of_period.clock_precision: exact), documented with these numbers, so anyone can switch it and reproduce either result.

IDENTICAL TEAM-GAMES UNDER EACH READING OF THE CLOCK · MEASURED
SeasonExact time (kept)Whole seconds (tested)Within one possession (kept)
2016-1780.3%98.2%98.3%
2018-1977.9%97.9%98.0%
2022-2377.8%97.3%97.1%
2024-2579.7%98.6%97.9%

Decision recorded on 2026-10-21. Exact-time numbers are from the latest full rebuild; whole-second numbers are from the test run before it, which used an earlier code version. That pbpstats reads whole seconds is an inference from comparing whole games, not something pbpstats documents.

PRINCIPLE

Never bend basketball logic to match a reference number. A mismatch is investigated and reported.

PRINCIPLE

Unknown means NULL. No invented IDs, times or values to fill a gap.

PRINCIPLE

Fail loudly. A row that cannot be mapped stops the load; data is never silently dropped.

One question I measured instead of guessing. When a substitution happens between a foul and its free throws, who gets credit? Most substitutions happen in exactly that dead ball: 28% of made free throws follow a substitution that came after their foul. Crediting free throws to the lineup on the floor at the foul (the reference's method) or to the lineup on the floor when the possession ends moves 548,053 points, 7.1% of all points, between lineups, and changes a typical player's on-off by about 1.2 points per 100 possessions (more than 1 point for four in ten players). The choice matters, so I measured it before deciding, and then kept the reference's method for free throws.

04 — OTHER FINDINGS

The same habit, applied to every source.

OFFICIAL TRACKING DATA

Players running 22 mph

5.0822.6highest average speed (mph): 2013-14 → 2024-25 vs 2025-26
3 gamesexplain all 44 flagged player-seasons

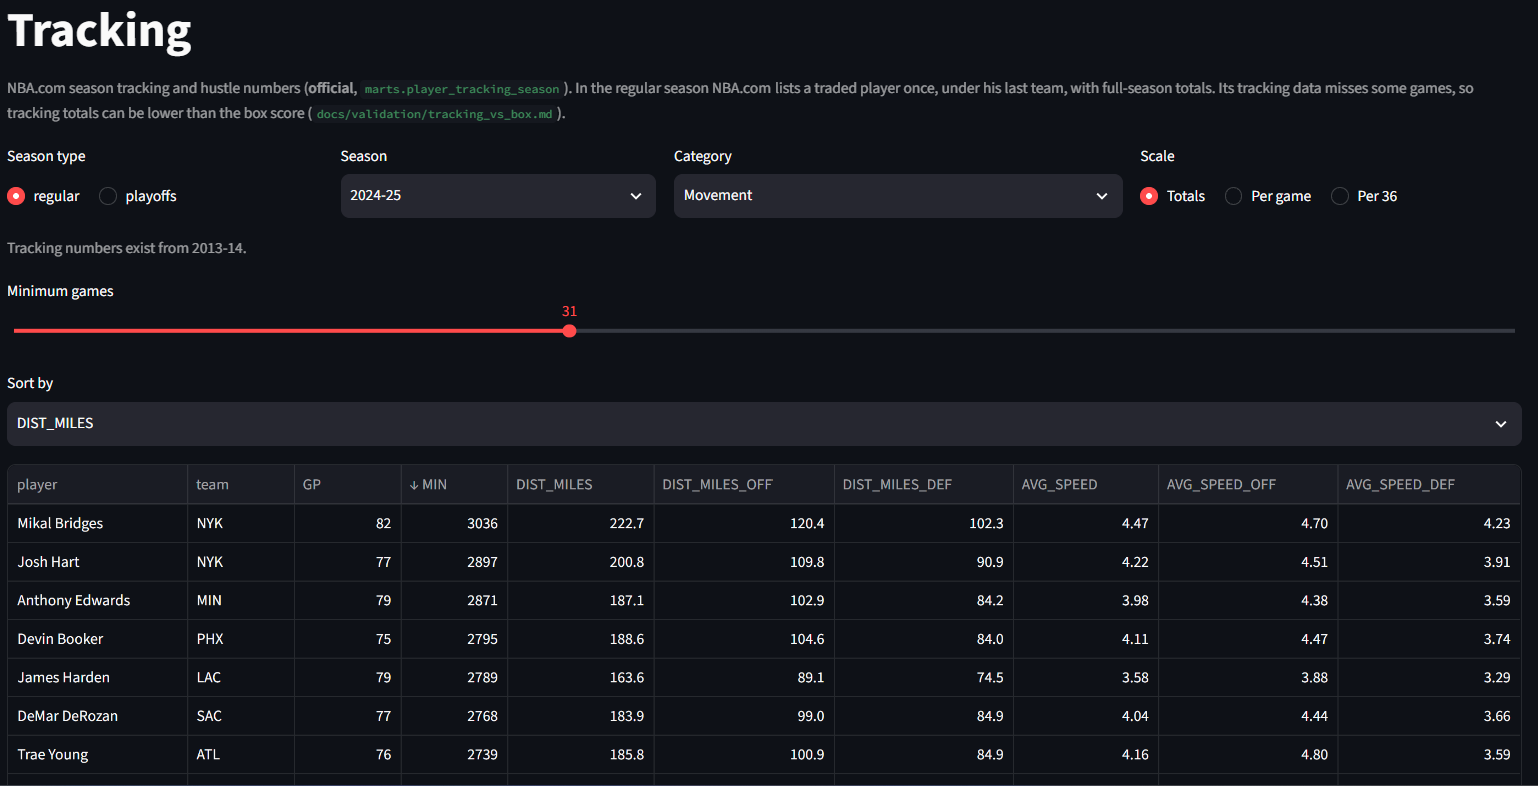
While reviewing my own dashboard I saw a rookie averaging 12 mph. NBA.com's 2025-26 season numbers for 44 players are physically impossible. Its single-game boxes trace every one to three games in which nearly every player "ran" 60 to 338 mph; without those games the same players average 3.9 to 4.8 mph. The rows are flagged, never deleted, and a report now checks tracking measurements every season.

MEASURED · FLAGGED, NOT DELETED
BOX SCORES

Recounting the official box score

≥ 99.7%player-games where my count equals the official one, for every statistic and season

Counting points, rebounds, steals and fouls from my own events and comparing them with NBA.com exposed two era-specific encodings: which player field carries the steal, and a new technical-foul code in 2023-24.

MEASURED · ALL SEASONS
SECOND SOURCE

Cross-checking a purchased dataset

2 / 8,883games with a different final score
641 / 647lineup disagreements where box-score minutes side with my primary source

A purchased dataset is used only for validation. Where the two sources disagree on who was on the floor, official minutes and substitutions decide.

MEASURED · 7 SEASONS
05 — DASHBOARD

Every number says where it comes from.

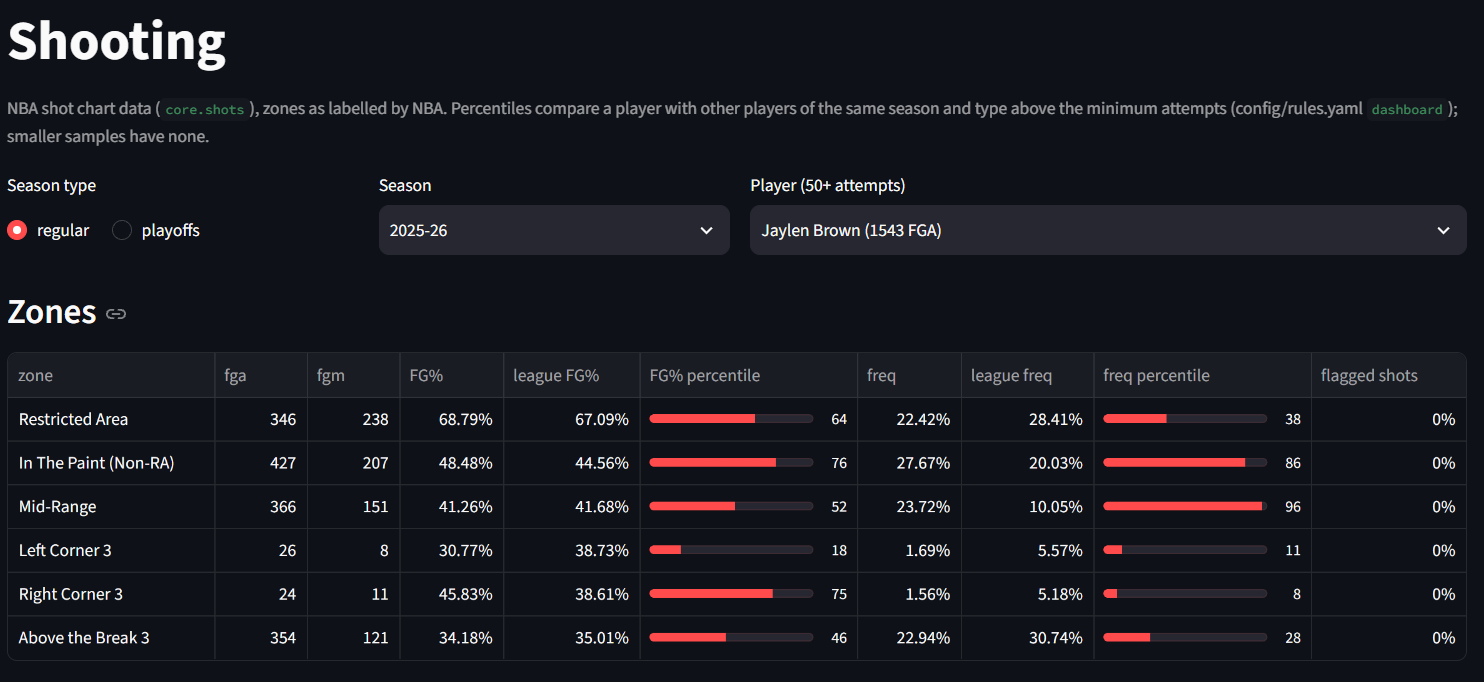
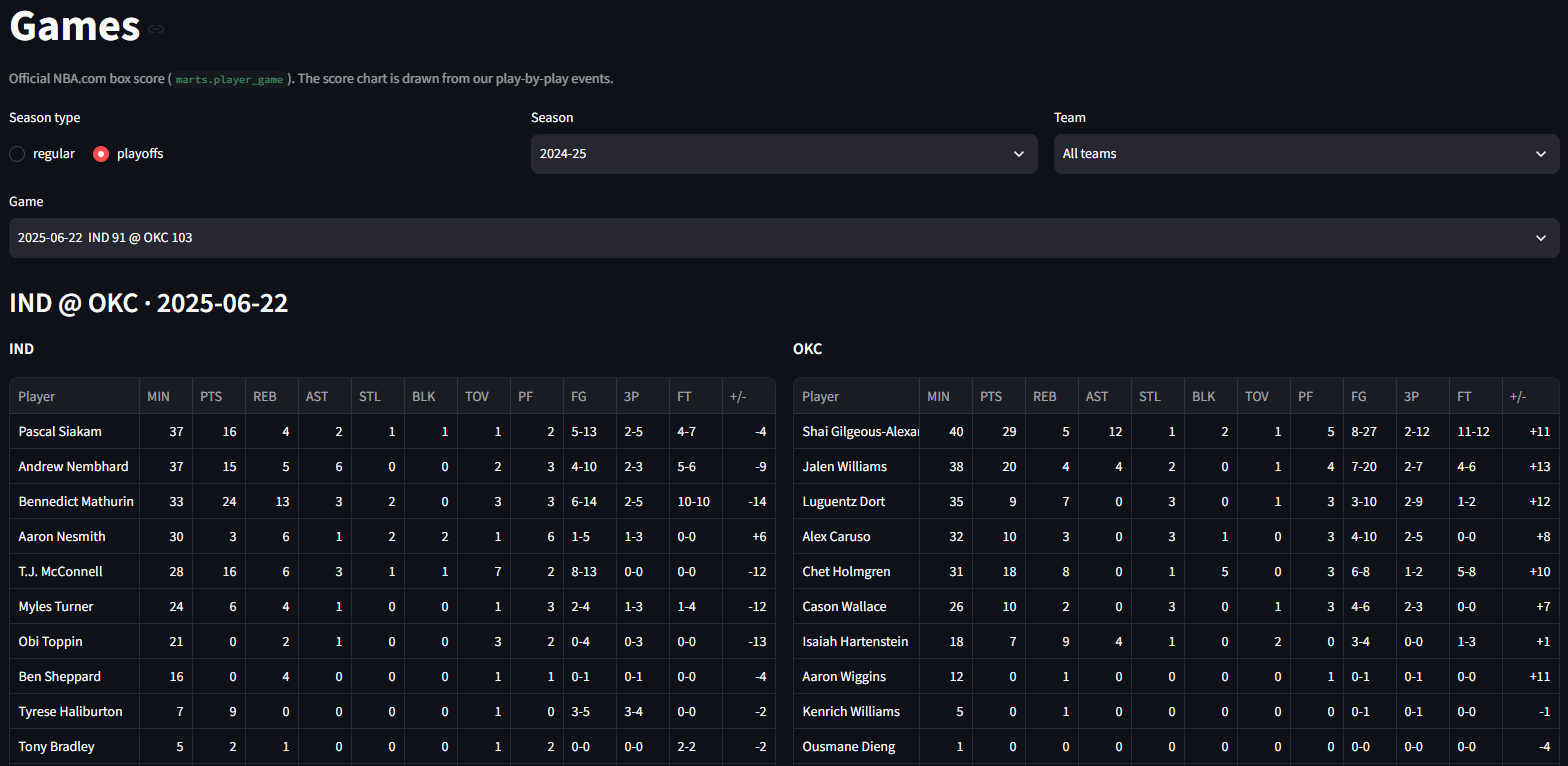
A read-only Streamlit app with twelve pages sits on top of the database. Besides box scores, shooting and tracking, five pages show numbers from my own possessions: team efficiency (with four factors), on/off, lineups, matchups (who guarded a player in a series, game by game) and a RAPM prototype with standard errors. Each figure is labelled as an official NBA.com value, a count from my own play-by-play, or a model result, and every rate has its possession count beside it. It runs locally and is not deployed publicly because of the data sources' terms.

Shooting page: one player's shot share and accuracy by court zone, with league percentile bars
ShootingShare and accuracy by zone, with league percentiles
Games page: official box score of the 2025 NBA Finals game between Indiana and Oklahoma City
GamesOfficial box score of a 2024-25 playoff game
Tracking page: distance and average speed leaderboard for 2024-25
TrackingDistance and speed, totals / per game / per 36 minutes
06 — WHAT IS AND IS NOT DONE

What is solid, and what is still open.

ESTABLISHED
  • 60 season files (regular season and playoffs, 1996-97 → 2025-26) loaded through two levels of checks
  • Stints and possessions for every season, each row stamped with its rules version and profile
  • A rebuild from zero reproduced all 11 loaded tables exactly (row counts and content hashes; checked before stints and possessions were added)
  • On/off, five-man lineup, two-man pair and team efficiency tables on top of the possessions, with checks that every possession and point is credited exactly once; team points equal the official box score for 1,365 of 1,372 team-seasons
  • RAPM prototype (ridge regression on possessions, penalty chosen by cross-validation grouped by game, bootstrap standard errors); its split-half reliability is 0.37 for one season and 0.57 for three, so single-season values are mostly noise
  • 324 automated tests, run before every commit and on every push, including real game sequences for the possession rules
OPEN OR NOT YET BUILT
  • RAPM beyond the prototype: more windows, priors, and a decision on how to publish it
  • A custom rule profile with my first documented deviations
  • Who gets credit when a substitution happens between free throws: measured, not yet decided (it moves 7.1% of all points between lineups)
  • 2017-18: I corrected 15 cases where a rebound was stamped after the event that follows it (checked against the official event numbers; the corrected sequences match pbpstats). 142 possessions with a missing end remain, 92 of them next to events the source added late; ordering rows by the official event numbers is not decided
07 — MY ROLE AND WHAT IS NEXT

My rules, reviewed step by step.

The basketball rules, the validation standards and every trade-off are mine, each recorded with its reasons in a dated decision log. The code was written with Claude (Anthropic) as a pair programmer under written working agreements: it proposed and implemented, I decided each rule and reviewed each step, and nothing was tuned to match a reference. Next come my own rule profile and a decision on how far to take RAPM. The same IDs already join NBA.com's matchup data to this database, and will link it to my Court Vision Tracker.

CODE AND DOCUMENTATION

Source, rules and validation reports

The rules file, the possession specification with worked examples, the decision log and every validation report are in the repository. No raw or third-party data is published.